The day my self-healing infrastructure healed itself to death
Every dashboard was green and every endpoint returned 200, while my Kubernetes cluster had quietly lost the ability to create pods. A post-mortem on automation that worked exactly as instructed.
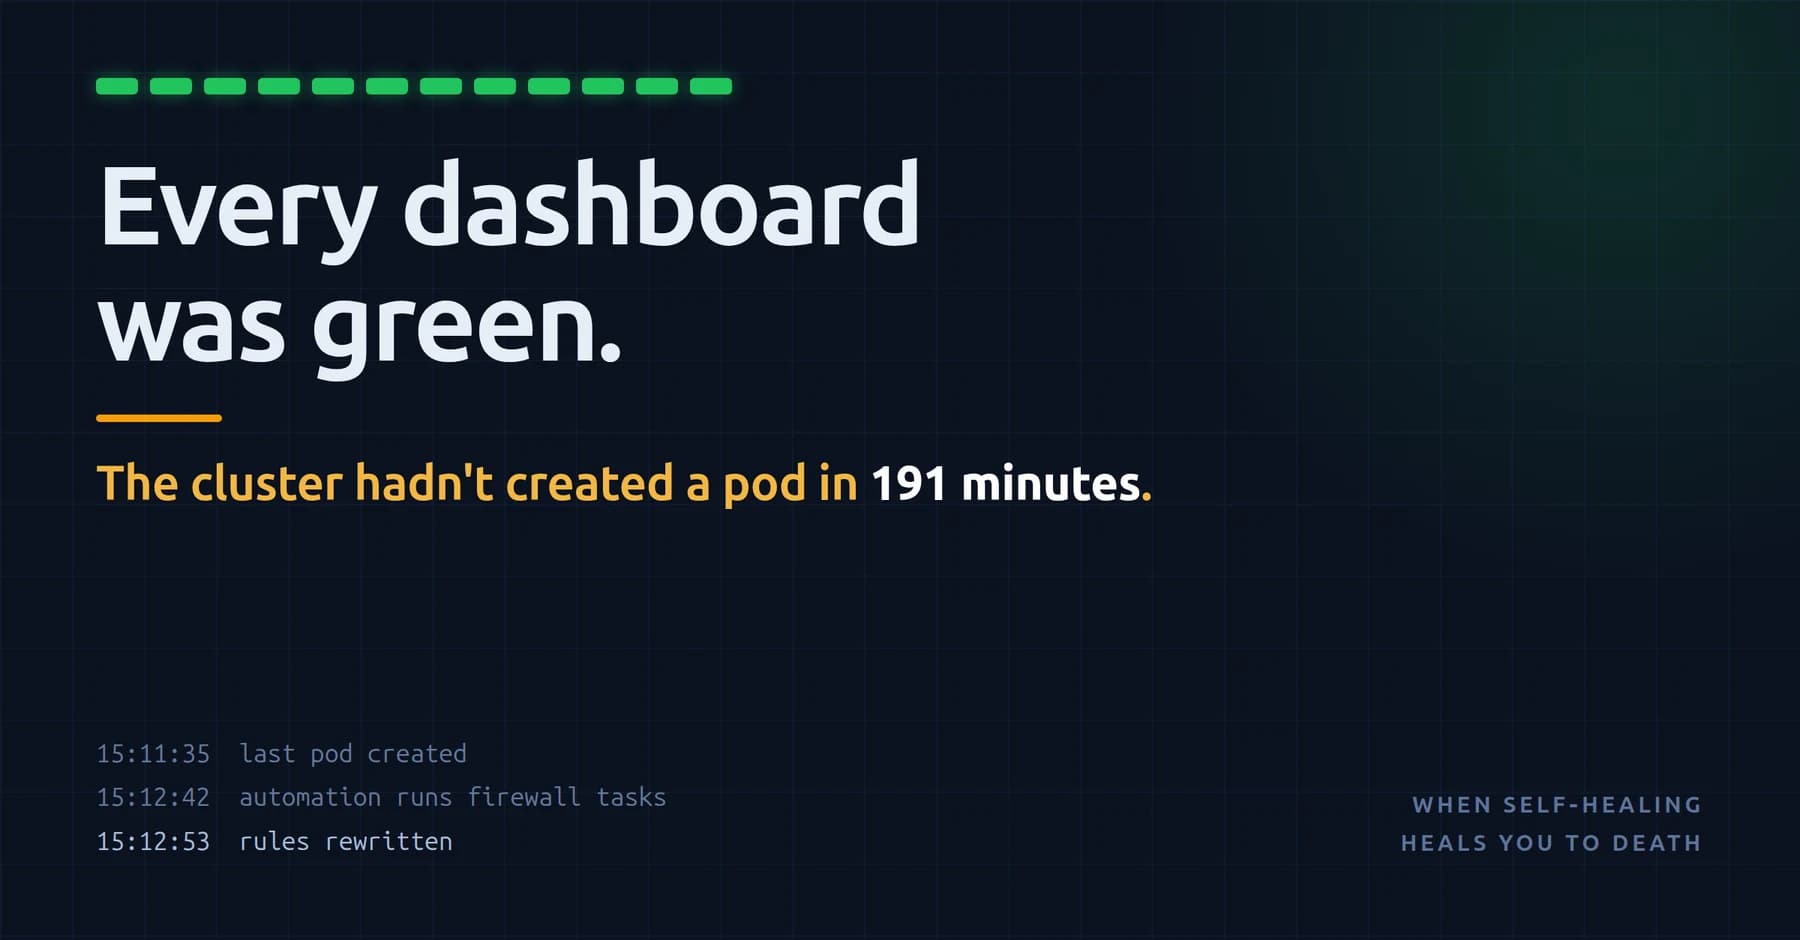
Every dashboard was green. Every endpoint returned 200. Every pod was Running.
And my Kubernetes cluster had been quietly dying for three hours.
The setup
My production server runs ansible-pull every five minutes. It fetches the desired state from Git and enforces it — firewall rules, SSH hardening, backups. Self-healing infrastructure. If something drifts, it snaps back. That's the whole point.
One of those tasks deletes “rogue” firewall rules: any open port not on the approved list. Reasonable, on the face of it.
The approved list had three entries: SSH, HTTP, HTTPS.
My Wazuh SIEM needed a fourth — the port its agents use for telemetry. Someone opened it by hand, months ago. It worked. Nobody wrote it down.
So every five minutes, for months, my automation dutifully deleted it. Twenty-six times in the log I still had. Each deletion reloads the firewall. Each reload flushes iptables and reasserts a routing policy that is quietly hostile to Kubernetes pod networking.
For months, k3s rebuilt its rules fast enough to survive. Then one reload landed at exactly the wrong microsecond.
What “broken” looked like
SSH: dead. The websites? Perfect. All of them.
That asymmetry is the whole story. Web traffic is redirected to pods before it ever touches the host's firewall rules. SSH isn't. The data plane kept humming while the control plane died — and every monitor I had was watching the data plane.
I worked the incident with Claude Code as my operator. Its first hypothesis was wrong, and it cost us: it assumed my IP had been banned. I switched networks. Still blocked. Switched again. Still blocked.
Then it asked the question that should have come first — an external port checker. The web port: open. The SSH port: closed. Not my IP. Everyone's. One question, thirty seconds, and an entire branch of the investigation collapsed. Its own summary afterwards: “the external port check should have been my first move, not my fourth.”
Finding the real damage
No SSH means no kubectl. But my monitoring stack answers over HTTPS, and HTTPS still worked. So Claude went in through the observability system and started interrogating the cluster about itself — Prometheus, Loki, kube-state-metrics, ArgoCD's own metrics, all still reachable from outside.
That's where it got bad. One query:
Time since the last pod was created, anywhere in the cluster: 191 minutes.
Not “a pod is unhealthy.” The cluster had lost the ability to create pods at all. Existing containers kept serving — which is why everything looked fine — but nothing could be replaced. Every running service was now a single point of failure with no recovery. One crash from a permanent outage, behind a wall of green dashboards.
Three dead signals, correlated to a single twenty-minute window: the kubelet metrics endpoint, log ingestion, and SSH. All host-plane. Nothing user-facing. That correlation is what turned “I can't SSH” into “the cluster is frozen” — and it took seconds, not hours.
The failure I want to talk about most
We tried to break in through the one path still working: push a diagnostic pod to Git, let ArgoCD schedule it, read the output.
It failed. Three times.
Because the cluster couldn't create pods. Our emergency access depended on the exact capability that was broken. Worse, the third attempt temporarily knocked my observability app out of sync — we were now debugging the rescue tool instead of the server.
Claude called it, reverted everything, and said so plainly: “I was debugging my own tooling instead of your server.”
That's the lesson I'd tattoo on a wall: a break-glass procedure that shares a dependency with the outage is not a break-glass procedure. I'd built a fire escape out of the same material as the building.
I rebooted from the provider console. SSH came back.
The smoking gun
The previous boot's logs told the story in three lines:
15:11:35  last pod created, cluster-wide
15:12:42  ansible-pull runs its firewall tasks
15:12:53  the firewall rules file is rewritten
Ninety seconds between a healthy cluster and a frozen one.
The fix was one line of YAML: add the missing port to the approved list. In two places — because this automation reads its config from a different location than a human running it by hand does. A trap we'd documented the week before and still nearly walked into again.
Then: a dry run proving zero rules were now flagged, a full automation cycle returning changed=2, failed=0, and a canary pod deployed purely to prove the cluster could create pods again. Succeeded.
What the AI actually contributed — and what it didn't
The honest version, because the honest version is more useful.
Where it was genuinely better than me. It kept a way in when I had none, by treating the monitoring stack as a query interface rather than a set of dashboards. It correlated three unrelated-looking failures to one timestamp in seconds. It read across a reboot boundary, reconciled server-local time against UTC, and found a ninety-second causal window in thousands of log lines. It remembered a config trap from a previous week that I'd have rediscovered the hard way. And it wrote the incident record, the fix, and the verification while I was still catching up.
Where I was better than it. It proposed adding a “no pods created in N hours” alert. I rejected it — a stable cluster legitimately goes days without creating a pod. It then proposed a kubelet-down alert; I pushed back again, and checking the data showed that alert already existed and had fired correctly fourteen minutes in. The right answer wasn't more alerts. It was less noise. And the call to reboot — the thing that actually restored access — was mine.
Where it was simply wrong. The IP-ban theory, three failed rescue attempts, and it told me the outage lasted five hours when the logs say three hours twenty. It corrected that itself when I asked it to check.
The pattern I'd draw from this: AI compressed the investigation — the querying, correlating, log archaeology and writing — from hours into minutes. It did not replace judgment about what to do with the findings. Every good decision in this incident came from the two working against each other, not from either alone.
What I'd tell my past self
Idempotency is a claim to verify, not assume. A task reporting “changed” on every run isn't maintaining state — it's fighting something. That line was visible for months. Nobody read it, because nothing was on fire.
An incomplete allow-list isn't a gap — it's a destructive instruction. “Delete anything not on this list” is only as safe as the list is complete, and lists maintained by humans drift the moment someone opens a port at 2am.
Green dashboards measure what you told them to measure. Mine watched pods changing state. A cluster that silently loses the ability to change state fires nothing at all.
And the hardest one: my alerting worked. It caught the failure in fourteen minutes and emailed me. I skimmed it — because it arrived as one warning among thousands. A single misconfigured staging app had fired 7,046 times that fortnight. Alert noise isn't an annoyance. It's a safety system being switched off one ignored email at a time.
We talk about automation as though the risk is that it stops working. Often the real risk is that it keeps working perfectly — faithfully executing an instruction that was subtly wrong from the day it was written, every five minutes, until the day it finally catches you.
If you run self-healing infrastructure, go and grep your automation's logs for the word “changed”. Anything reporting it on every single run is not converged — it's fighting something, and it has been winning for longer than you think.
We build and run production systems for founders and small teams — including the monitoring that has to catch what green dashboards miss. If you'd like a second pair of eyes on yours, talk to us.
Part of the MoyoLab team building AI-powered products and platforms for founders and growing teams.
Share this article
Related Posts
I thought AI was going to make me lazy. Then I started treating it like a colleague.
For months I avoided using AI for "real" engineering work, afraid it would make me lazy. Then I changed how I worked with it — not as a slot machine, but as a colleague. Here's the pattern that flipped the relationship and made me sharper, not duller.
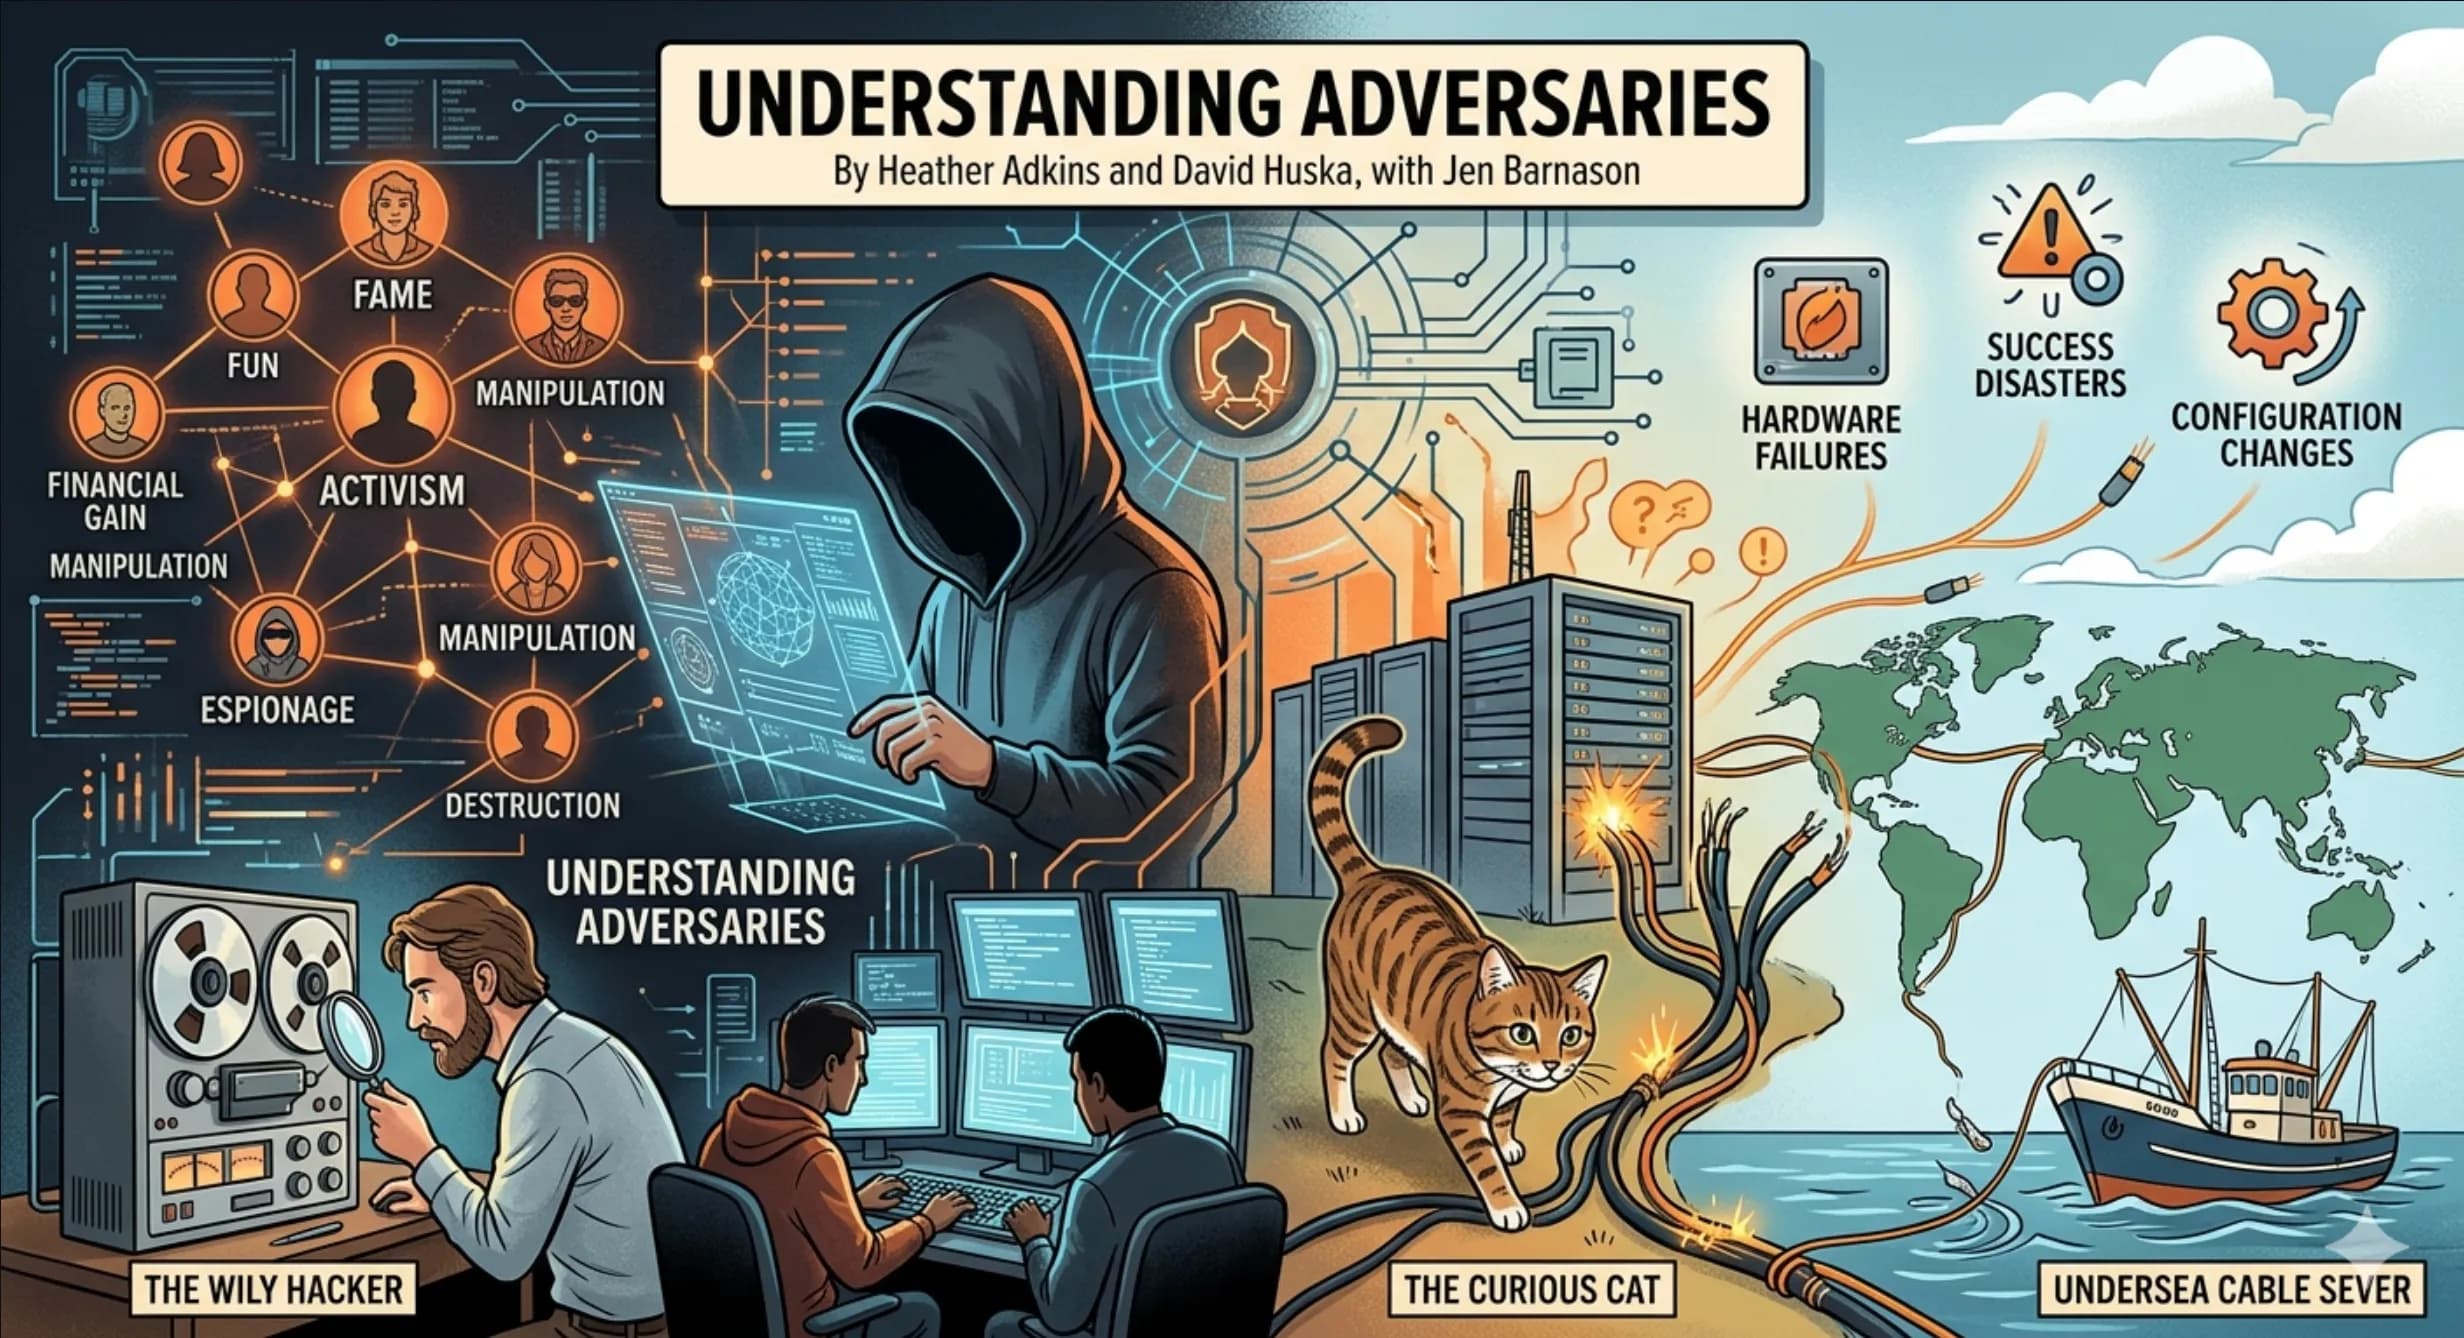
Why Every Founder Needs an Adversarial Mindset (Even If You're "Too Small to Be a Target")
The "we're too small for hackers" assumption has bankrupted more startups than bad product-market fit. Here's how to think about who might attack your business — and what to do about it before you ship.